Dashboards·terminal·MIT
session-meter
Context by category, usage limits with pace, tool calls and model requests in a pane.
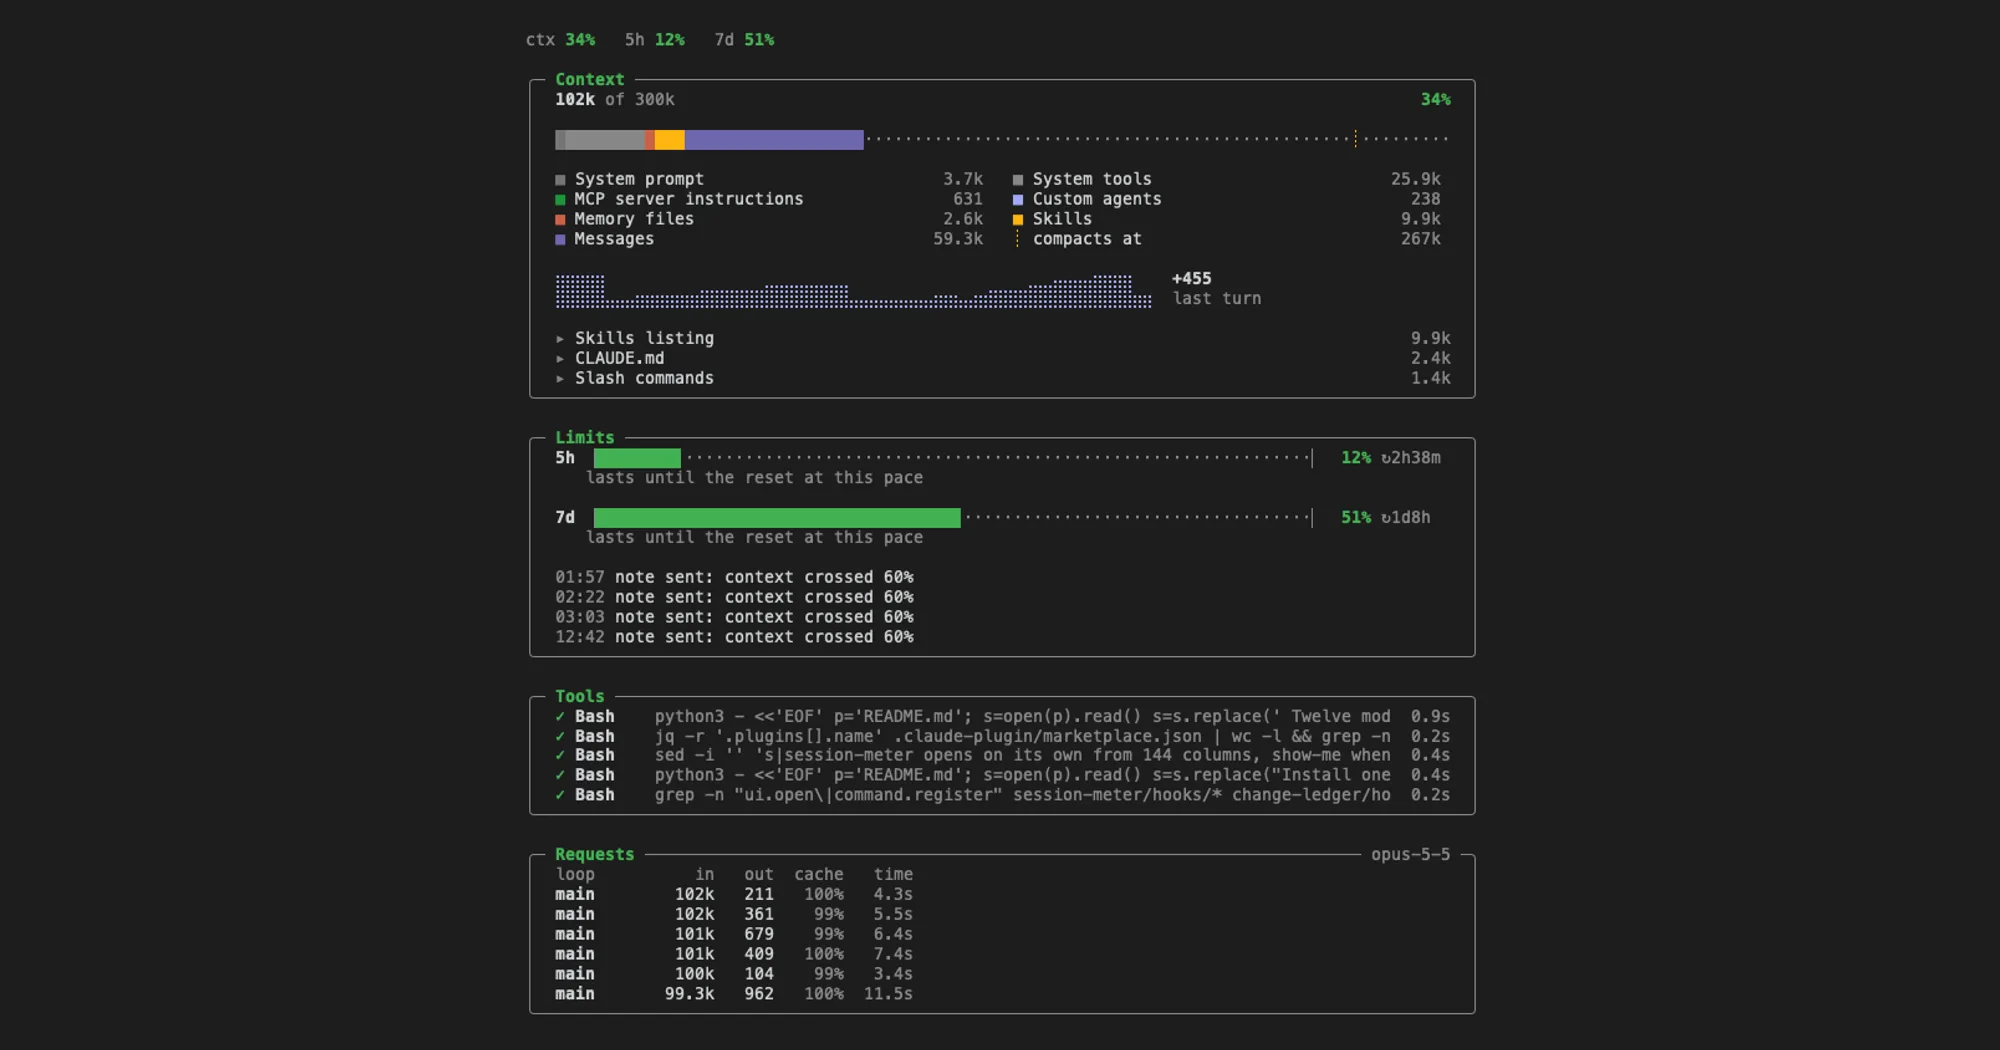
session-meter shows what fills the context window and how fast your usage limits drain, in a pane docked beside the Claude Code transcript. It also lists every tool call and every model request with its cache hit rate, and tells the model once when a limit or the context runs high.
What it does
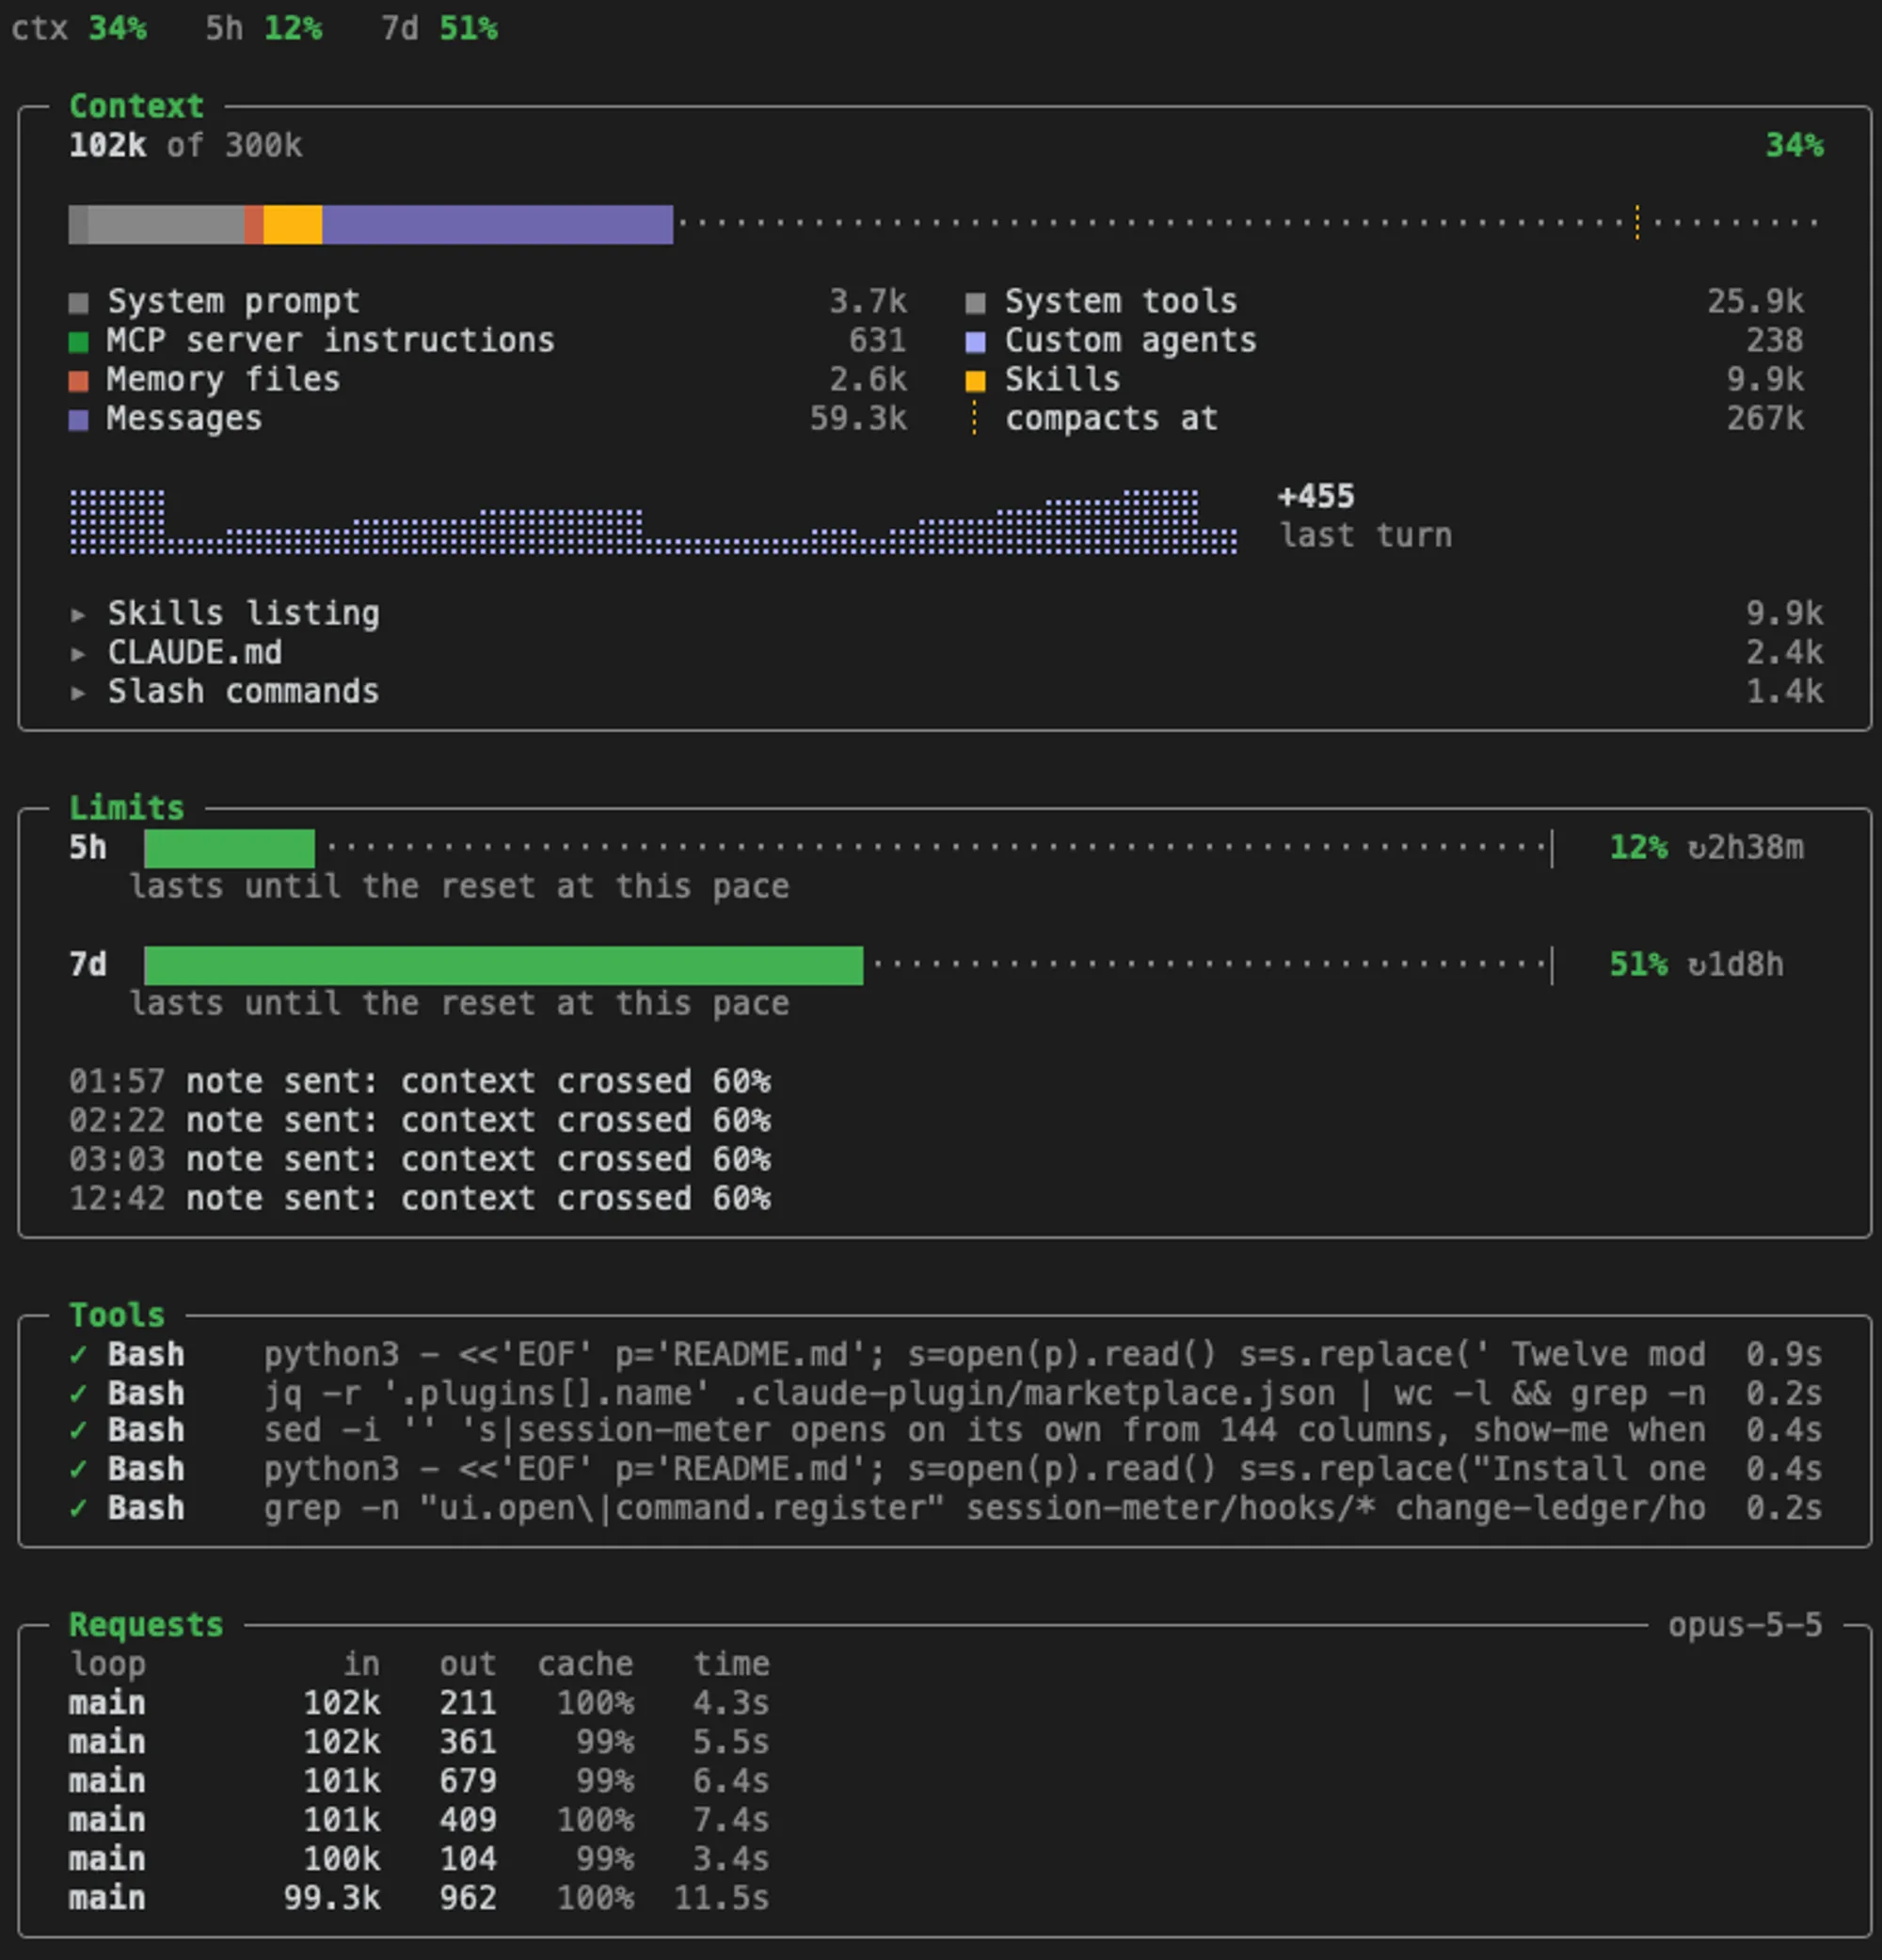
- Context: tokens used out of the window, one bar split by category (system prompt, tools, MCP instructions, memory files, skills, messages) with the auto-compact point marked, a chart of the context size over turns with the last turn’s growth, and the three heaviest items, such as a memory file, an MCP server or the skills listing.
- Limits: the 5-hour and 7-day windows with the time to reset and a pace line, either “lasts until the reset” or “full in” so long. The projection counts idle time, so it errs late rather than early.
- Tools: recent calls with their target (the command, file name, pattern or URL) and duration. Running calls stay on top; subagent calls are marked
↳. - Requests: each model request with its loop (main or the subagent type), input and output tokens, cache hit rate and time. The rate turns yellow under 50% and red under 20%.
- A top line keeps three numbers in view: context, 5h and 7d percentages.
The note to the model
When a figure crosses a threshold, session-meter adds a short note to your next message that you do not see:
- 5-hour window at 80%: mention it in one line and keep working.
- 7-day window at 80% and again at 90%: warn clearly and ask before starting a large task.
- Context at 60%: when new work starts, suggest
/compact, a fresh session or a short handoff, whichever fits.
Each note fires once and re-arms only after the figure falls 10 points below the threshold, as after a window reset or a /compact. It goes in as prompt context, not as a change to the system prompt, so the prompt cache stays valid. It does cost the tokens of a few lines of text, once per crossing. The Limits frame lists each note sent, with its time.
Install
Needs Claude Code 2.1.287 or later.
claude plugin marketplace add arasovic/claude-code-mods
claude plugin install session-meter@claude-code-mods
Restart Claude Code. In a terminal 144 columns or wider the pane opens on its own; otherwise run /ctx. It docks beside the transcript in fullscreen mode, from 110 columns.
The marketplace holds twelve mods by the same author, each installed on its own: cache-timer, change-ledger, compact-keeper, guardrails, image-peek, loop-guard, search-meter, secret-guard, session-meter, show-me, turn-footer and turn-timeline.
How it works
The context and limit figures come from Claude Code’s own usage data, read at session start and on each session.measure event. Context percentages use the same breakdown as /context, so they measure against the auto-compact window and follow CLAUDE_CODE_AUTO_COMPACT_WINDOW if you set it.
tool.call and turn.step time each tool call and model request. To label a call, the mod reads the tool’s input: the command, file path, pattern, URL or query. It keeps the last 30 tool calls and 30 requests in its own state. The note goes in through prompt.submit. It makes no network calls.
Limitations
- Usage limits appear after the session’s first model reply, and the pace line needs about 10 minutes of history in the current window.
- When the pane cannot dock,
/ctxreplies with the reason it is waiting. - The author documents it only in the terminal.
More mods
The whole directory →
agent-flow
Every subagent of the session in a live tree beside the transcript. Zero tokens.
agent-profiler
Model wait, tools and subagents as shares of session time, live, with OTLP export.
todos
The repo's TODOs and FIXMEs above the prompt at session start, newest first.
budget-guard
Warns at 80% of a cost or plan-window limit you set, then refuses tool calls past it.